
In a report published on June 8, 2026, Hitachi Energy described a completed delivery of two large power transformers from its Łódź factory to a U.S. hyperscale data-center project. They travelled by road to Warsaw and by air through Chicago. The manufacturer described the project as time-critical. [1]
The case puts a physical milestone inside a boom usually described through dollars, leases and megawatts. It shows one successful effort to get important equipment to a project. It does not tell us when the site was energized, how much expedited transport cost or how representative the shipment was.
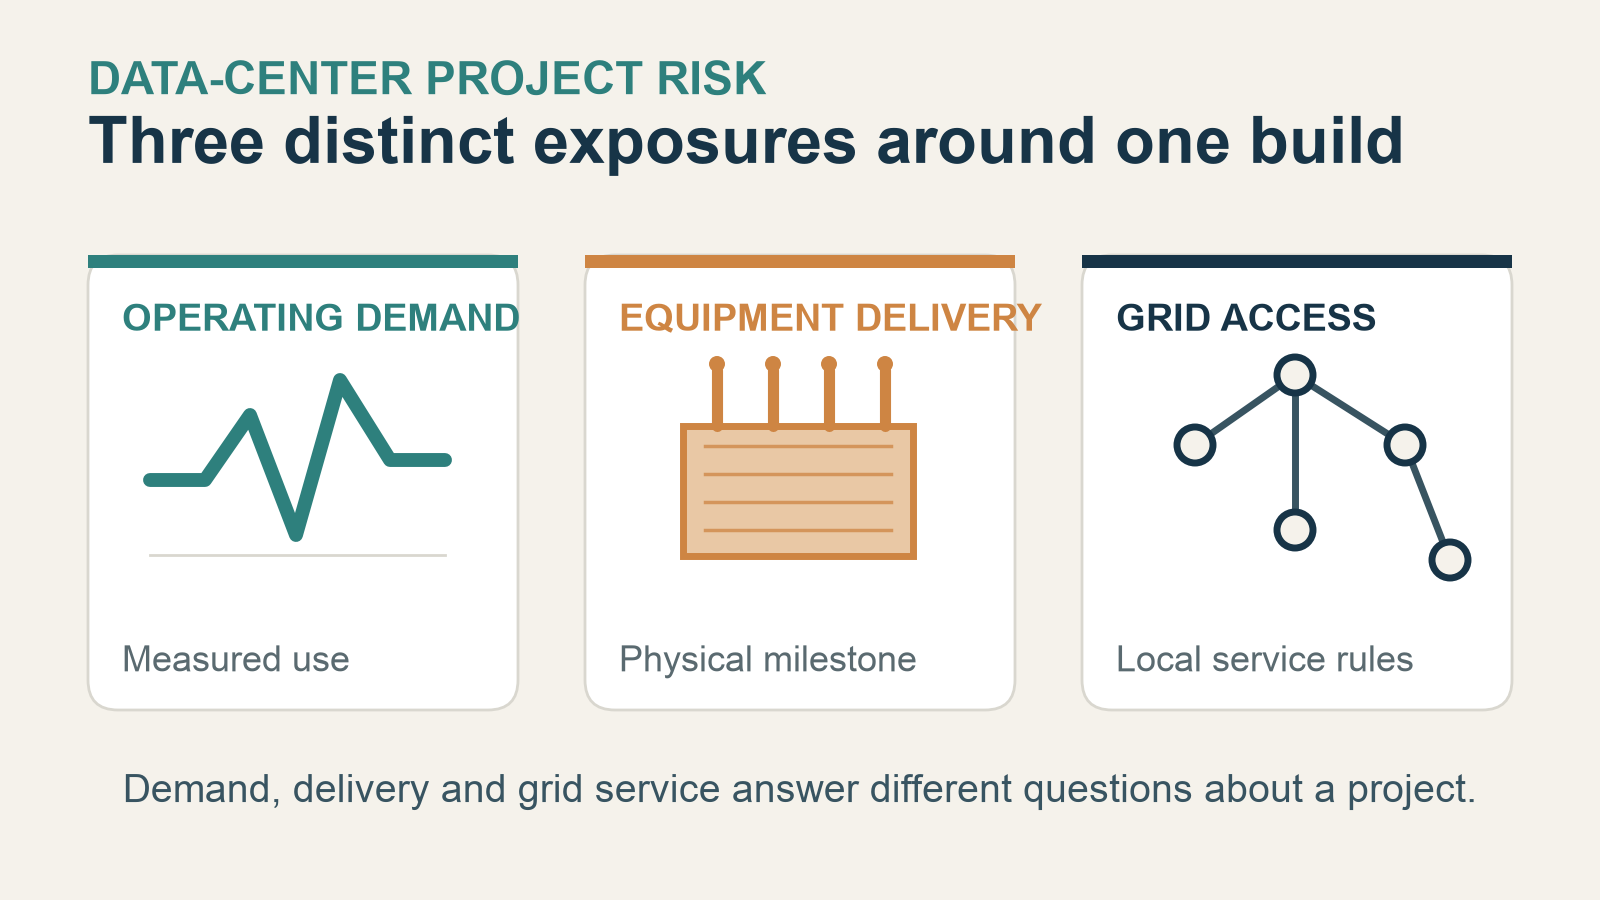
That distinction matters economically. A growing market can support demand for additional capacity while leaving individual projects exposed to very different procurement, construction and grid-service risks. Recent evidence makes those differences more visible: actual cloud-site load is growing in ERCOT's monitored sample; a U.S. switchgear producer-price index has risen; and six other power markets have been asked to address large-load integration through their tariffs.
These observations cover different places, dates and populations. They identify separate exposures rather than a single measured causal chain. Together, they offer a richer explanation of the boom than the size of the construction pipeline alone.
A growing operating market can still lose proposed projects
ERCOT's February 4, 2026 System Operations Update provides an operating-demand observation. Its monitored sample covers about 400 cloud-based data-center sites of at least 1 MW, including cloud computing, storage, colocation and AI, while excluding cryptocurrency sites. The report says average daily MW in the sample grew 15.5% from January 2025 to January 2026. [2]
That is evidence of greater electrical load in an operating cloud-site sample. It is broader than AI alone and measures neither computing output nor customer revenue. Even with those limits, it is a materially different observation from a developer announcing a future project.
ERCOT's March 2026 TAC report separately described cancellations in its large-load interconnection queue. [3] The two reports do not follow a matched set of projects, and their dates differ. The January operating comparison does not establish what happened to operating load in March. They nevertheless show why operating growth and attrition among proposed projects can appear in the same industry's reporting.
Operating growth and proposed-project exits are separate observations
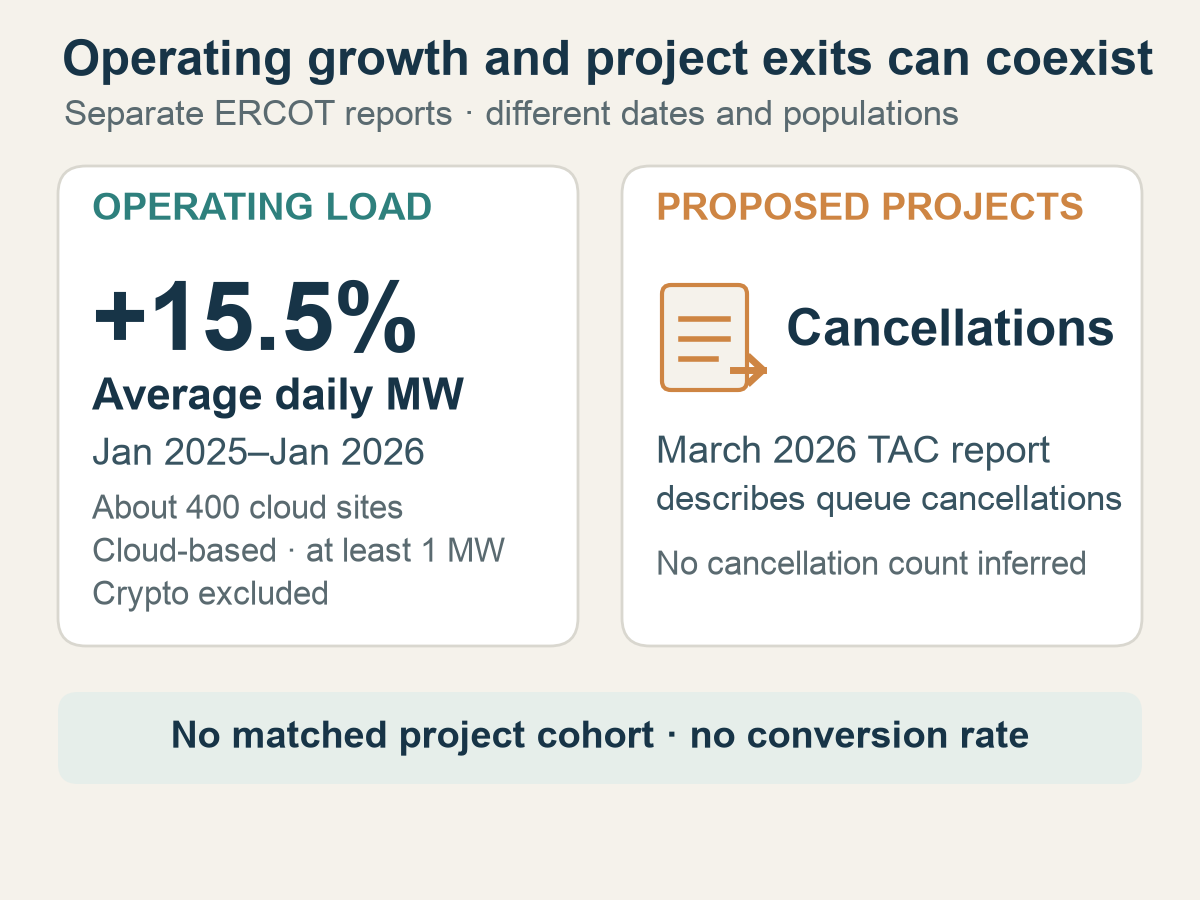
ERCOT reports 15.5% average-daily-MW growth from January 2025 to January 2026 in about 400 cloud-based sites of at least 1 MW, excluding crypto. A separate March 2026 queue report describes project cancellations. The observations are not a matched cohort.
ERCOT reports, January 2025–March 2026 · separate observations
Select or focus a chart item to read its scope and limitation.
View exact data: Operating growth and proposed-project exits are separate observations
| Observation | Value | Scope and limitation |
|---|---|---|
| Operating cloud-site sample | +15.5% | Average-daily-MW growth from January 2025 to January 2026 across about 400 monitored cloud-based sites of at least 1 MW; excludes cryptocurrency sites. |
| Large-load queue | Cancellations reported | Separate March 2026 TAC report. It is not the same cohort as the January operating-load sample and does not provide a conversion rate. |
A queue exit does not identify its own cause. It could reflect changed demand expectations, a revised location, duplicated planning or an unattractive project timetable. The report does not choose between those explanations. Cancellation news alone therefore cannot establish a collapse in the underlying cloud-demand trend.
The economic distinction is between a market and a particular route into that market. Higher measured load across ERCOT’s monitored cloud-site sample creates a reason to consider expansion; the figures do not show whether load rose at each site or through changes in the sample. It does not make every proposed site, schedule and cost structure viable. A project can be withdrawn inside a growing market without the operating demand being imaginary.
This changes the meaning of both optimistic and pessimistic headlines. A large queue is a set of conditional proposals, not a guaranteed future load. A smaller queue can signal a change in those proposals without establishing a reversal in measured operating load. Grid planners face a two-sided risk: treating every proposal as certain can overstate future requirements, while dismissing the queue as speculative can overlook growth already visible in operating data.
Tight capacity does not settle the cost of delivering it
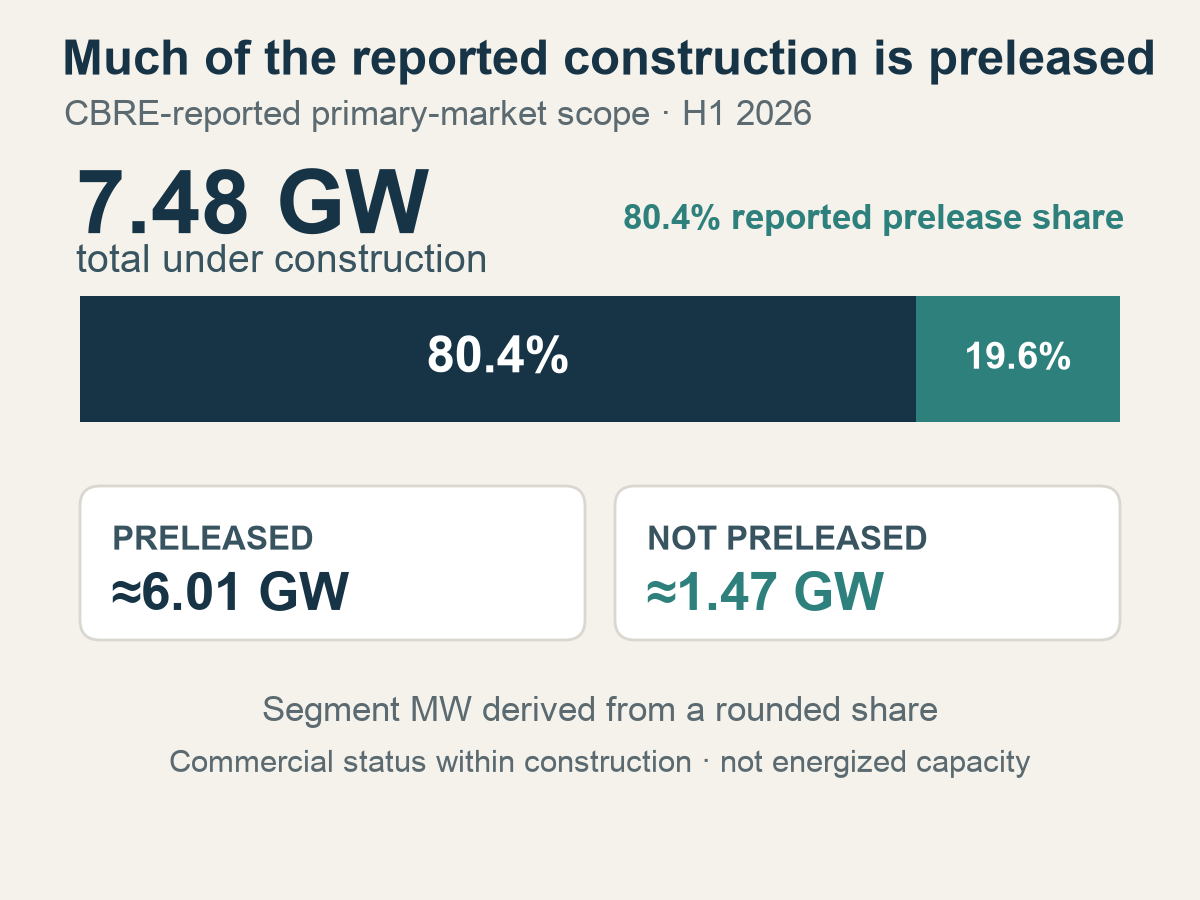
The broader property-market evidence supports the presence of an active buildout. CBRE reported 10,903 MW of primary-market inventory in H1 2026, up 33.7% year over year, alongside a 1.4% vacancy rate. The tracker snapshot used here records about 7.48 GW under construction; CBRE reported that 80.4% of construction was preleased. [4]
These figures describe CBRE's reported primary markets, not the ERCOT cloud-site sample. Inventory also means reported market supply, not independently verified energized IT capacity. Within those definitions, rising inventory and low vacancy are a counterweight to a picture of a market that has stopped adding or occupying space.
Construction capacity split by reported prelease share
A 7.48 GW construction balance comprises approximately 6.01 GW preleased and 1.47 GW not preleased, derived from an 80.4% prelease share. H1 2026 CBRE-reported primary markets.
Under construction: 7,481 MW · CBRE-reported H1 2026 primary markets; tracker snapshot dated October 3
Preleased: Derived from the reported rounded 80.4% prelease share and 7,481.0 MW tracker snapshot.
Not preleased: Complement of the reported rounded 80.4% share. Neither segment measures energized or immediately available capacity.
Select or focus a chart item to read its scope and limitation.
View exact data: Construction capacity split by reported prelease share
| Construction status | Share | Approximate MW | Interpretation |
|---|---|---|---|
| Preleased | 80.4% | ≈6,015 MW | Commercial status within construction; not energized capacity. |
| Not preleased | 19.6% | ≈1,466 MW | Derived complement; not immediately available capacity. |
For a developer, however, evidence of demand is only one part of the return calculation. The cost of supplying that demand can move at the same time.
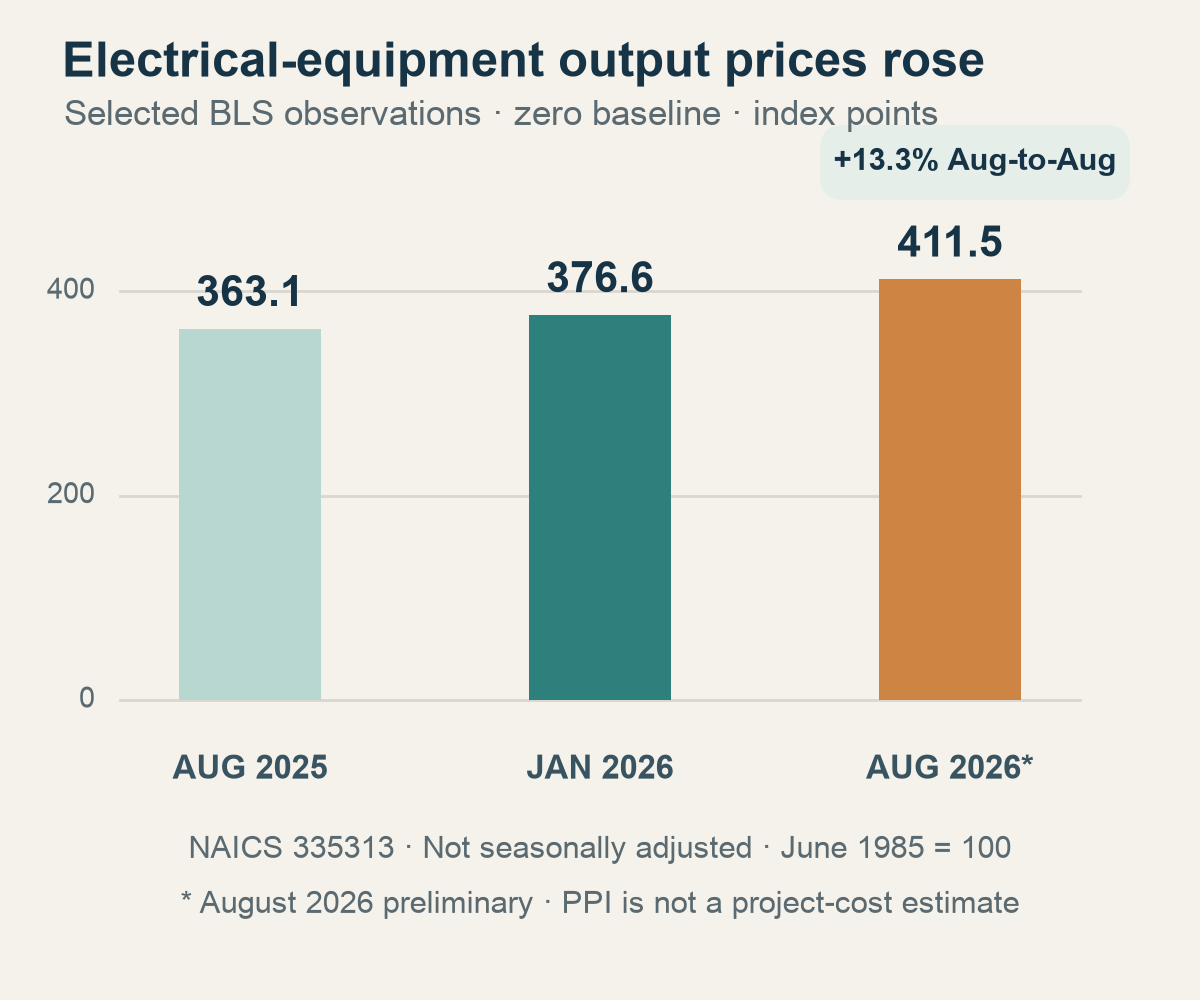
The BLS producer-price index for U.S. switchgear and switchboard apparatus manufacturing rose from 363.074 in August 2025 to a preliminary 411.453 in August 2026: an increase of about 13.3%. This is the same national, not-seasonally-adjusted industry series in both periods. [5]
Selected switchgear and switchboard producer-price observations
Selected BLS switchgear and switchboard apparatus manufacturing PPI values rise from 363.074 in August 2025 to 376.630 in January 2026 and 411.453 in August 2026, the last preliminary. The two August observations imply about 13.3% growth.
index points · U.S. PPI, NAICS 335313; June 1985 = 100; not seasonally adjusted
Select or focus a chart item to read its scope and limitation.
View exact data: Selected switchgear and switchboard producer-price observations
| Observation | Index points | Notes |
|---|---|---|
| August 2025 | 363.074 | Year-earlier comparison observation. |
| January 2026 | 376.630 | Selected mid-period observation. |
| August 2026 | 411.453 · preliminary | The two August values imply about 13.3% year-over-year output-price growth; this is not a data-center project-cost estimate. |
That is a concrete equipment-price pressure, rather than a measure of total data-center construction cost. Switchgear is not the transformer delivered in Hitachi's example, and the index cannot explain that shipment's urgency. Nor does a producer-price increase establish what any individual customer paid: procurement dates, specifications and agreements can differ.
The implication is still significant. A tight space market does not, by itself, establish a wider development margin. Higher selling prices or stronger leasing can coexist with more expensive inputs. A project whose equipment has already been secured has a different remaining cost exposure from one still buying it. How much of the increase is passed on to customers is not established by these data.
The Hitachi delivery also supplies a useful counterweight to a blanket bottleneck story. Equipment did reach a project. International sourcing and coordinated logistics can solve a particular delivery problem. One successful shipment does not establish typical lead times, but it shows why procurement should be assessed through outcomes as well as through forecasts of shortages.
The combined reading is a real operating market with identifiable input-price pressure and project-specific ways of managing delivery. It supports neither an automatic margin windfall from low vacancy nor an assumption that every build is stuck.
Hardware can move across borders; grid service is local
The transformer shipment crossed borders. Grid access depends on the service arrangements of a particular power system. Solving the hardware problem does not settle the terms under which a new load connects to and uses that system.
On June 18, 2026, FERC issued tailored show-cause orders covering six RTOs and ISOs: PJM, MISO, SPP, CAISO, ISO-NE and NYISO. The action required those markets to respond on large-load integration and related tariff issues. ERCOT was not among the six; its operating-load observations should not be read as an outcome of these FERC proceedings. [6]
In a September 22 concurrence, FERC commissioners described the proceedings as underway, with proposals still requiring review. [7] That establishes the procedural position described in that document. It does not establish that new tariffs had been implemented, that connection times had shortened or that a national shortage had been measured.
Large-load integration proceedings remain a regional process
On June 18, 2026, FERC issued tailored show-cause orders covering six RTOs and ISOs. A September 22 concurrence described the proceedings as underway. The set includes PJM, MISO, SPP, CAISO, ISO-NE and NYISO, not ERCOT.
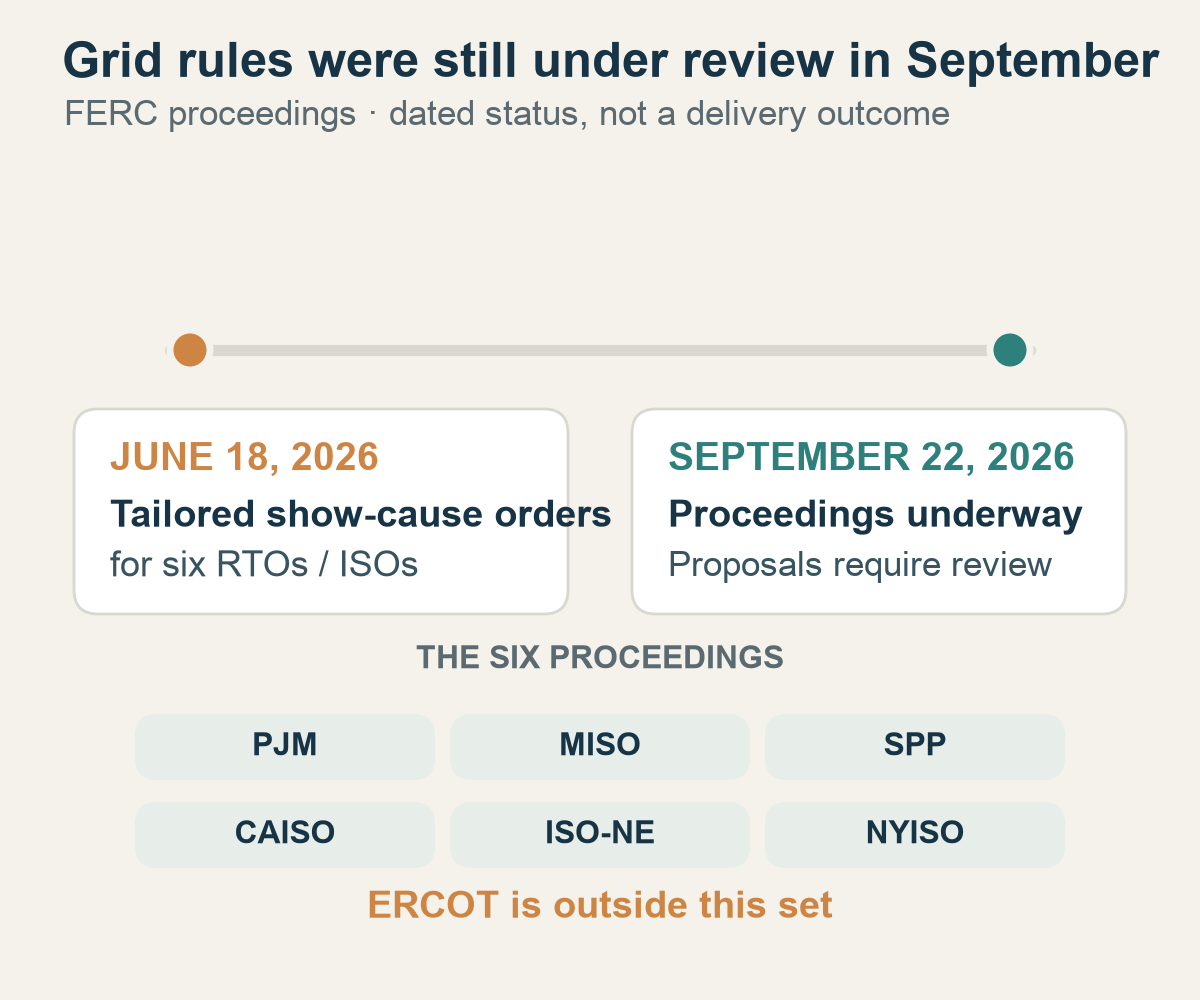
June–September 2026 · procedural milestones
Select or focus a chart item to read its scope and limitation.
View exact data: Large-load integration proceedings remain a regional process
| Date | Milestone | Scope and limitation |
|---|---|---|
| June 18, 2026 | FERC issues tailored show-cause orders | Orders cover PJM, MISO, SPP, CAISO, ISO-NE and NYISO. ERCOT is not in this set. |
| September 22, 2026 | Proceedings described as underway | A FERC joint concurrence describes proposals as still requiring review; no connection-time or reform outcome is measured. |
The economic relevance lies in the questions being decided. Connection, service and cost-allocation terms shape a project's exposure even when a building or a major piece of equipment exists. Construction spending cannot settle those institutional terms by itself.
FERC's use of tailored regional orders also matters. National construction totals compress projects operating under different power-system conditions into a single headline. Those totals can describe the scale of activity, but they cannot tell us that projects with the same stated MW face equivalent access, timing or service-cost risks.
For a customer that needs dependable capacity, the practical value is in a service that can be delivered at the required place and time. For a developer, commercial demand, equipment procurement and grid service are different exposures; progress in one does not automatically remove the others. For investors, broad market growth is therefore insufficient to establish the economics of every project participating in it.
There may be value in greater delivery certainty, but these sources do not measure a premium for it. That remains a hypothesis to test against actual contracts, completed milestones and project outcomes, rather than a return estimate supplied by the construction data.
The evidence supports growth, with different risks at each stage
The observations leave room for several things to happen together. Operating customers can use more electricity while some proposals are withdrawn. Reported inventory can expand while equipment prices rise. A transformer can reach a site while questions about large-load service are still being reviewed elsewhere.
That combination is more informative than a single boom-or-bust label. It suggests that the next useful distinctions are between operating demand and candidate projects, secured equipment and future purchases, and settled service arrangements and unresolved access terms. These are economic differences between projects, not interchangeable measures of industry enthusiasm.
The reading should change when the evidence changes. Sustained weakness in comparable ERCOT cloud-site monitoring would weaken the operating-demand signal. Lower equipment-price pressure, supported by broader evidence of dependable delivery, would reduce the procurement concern. Final regional tariff decisions followed by observed connection and energization outcomes would make the grid-service exposure easier to assess. None of those results should be inferred from a rising or falling construction total alone.
Growth is already visible in the Texas operating data examined here. Whether that growth becomes dependable service at a particular project depends on costs, connections and delivery outcomes that the aggregate MW headline leaves unresolved.
Which part should we track next: equipment deliveries or grid-access decisions?
Methods and scope
This article triangulates separate observations; it does not merge them into a common market panel, project cohort or conversion rate. ERCOT's 15.5% change is reported average-daily-MW growth for its cloud-site sample, not an AI-only measure. No underlying MW endpoints or energy totals were inferred.
The BLS comparison uses industry 335313, base June 1985 = 100, not seasonally adjusted: August 2025 363.074, January 2026 376.630 and August 2026 411.453. The last observation is preliminary. The 13.3% change is derived from the two August values; the figure shows selected observations, not a full monthly series. The index is not a deflator for total construction costs.
The October 3 tracker snapshot records H1 2026 construction of 7,481.0 MW; CBRE states 7,481.1 MW. Both round to the 7.48 GW shown here. The construction split is derived from CBRE's rounded 80.4% prelease share and does not measure immediately available or energized capacity. Hitachi's June 8 date is the report's publication date; the actual delivery date was not disclosed. Public sources are linked below.
Sources
[1] Hitachi Energy, June 8, 2026. Reported transformer delivery to a U.S. hyperscale data-center project. https://www.hitachienergy.com/news-and-events/features/2026/06/from-europe-factories-to-the-world-digital-backbone-european-made-transformers-power-critical-ai-infrastructure
[2] ERCOT, February 4, 2026. System Operations Update, cloud-based data-center observations, slide 15. https://www.ercot.com/files/docs/2026/02/04/9.3-System-Operations-Update-REVISED.pdf
[3] ERCOT, March 2026. TAC report, large-load queue observations. https://www.ercot.com/files/docs/2026/03/12/March-TAC-Report.pdf
[4] CBRE. North America Data Center Trends H1 2026. https://www.cbre.com/insights/books/north-america-data-center-trends-h1-2026
[5] U.S. Bureau of Labor Statistics. Producer Price Index, selected U.S. industries, switchgear and switchboard apparatus manufacturing. https://www.bls.gov/regions/mid-atlantic/data/producerpriceindexselect_us_table.htm
[6] FERC, June 18, 2026. Large-load integration action covering six RTOs and ISOs. https://www.ferc.gov/news-events/news/ferc-launches-aggressive-targeted-action-speed-large-load-integration
[7] FERC, September 22, 2026. Joint concurrence discussing the proceedings' status. https://www.ferc.gov/news-events/news/chairman-swett-and-commissioner-sees-joint-concurrence-commonwealth-edison-er26