
In Q2 2026, 45.2% of employed U.S. adults aged 18–64 reported using generative AI for their jobs, according to the FRED work-use series. That compares with 35.1% in Q2 2025, a derived increase of about 10.1 percentage points. Worker reach is rising, yet few categories of work have majority adoption of regular AI help. For investors, the question is which uses can become paid, dependable workflows that customers value.
Worker reach and task-category adoption thresholds
Two panels: worker reach rises from 35.1% in Q2 2025 to 45.2% in Q2 2026; in a separate Aug. 2025–May 2026 task analysis, more than 40% of O*NET task categories exceed 20% adoption, fewer than 3% exceed 50%, and none exceed 70%.
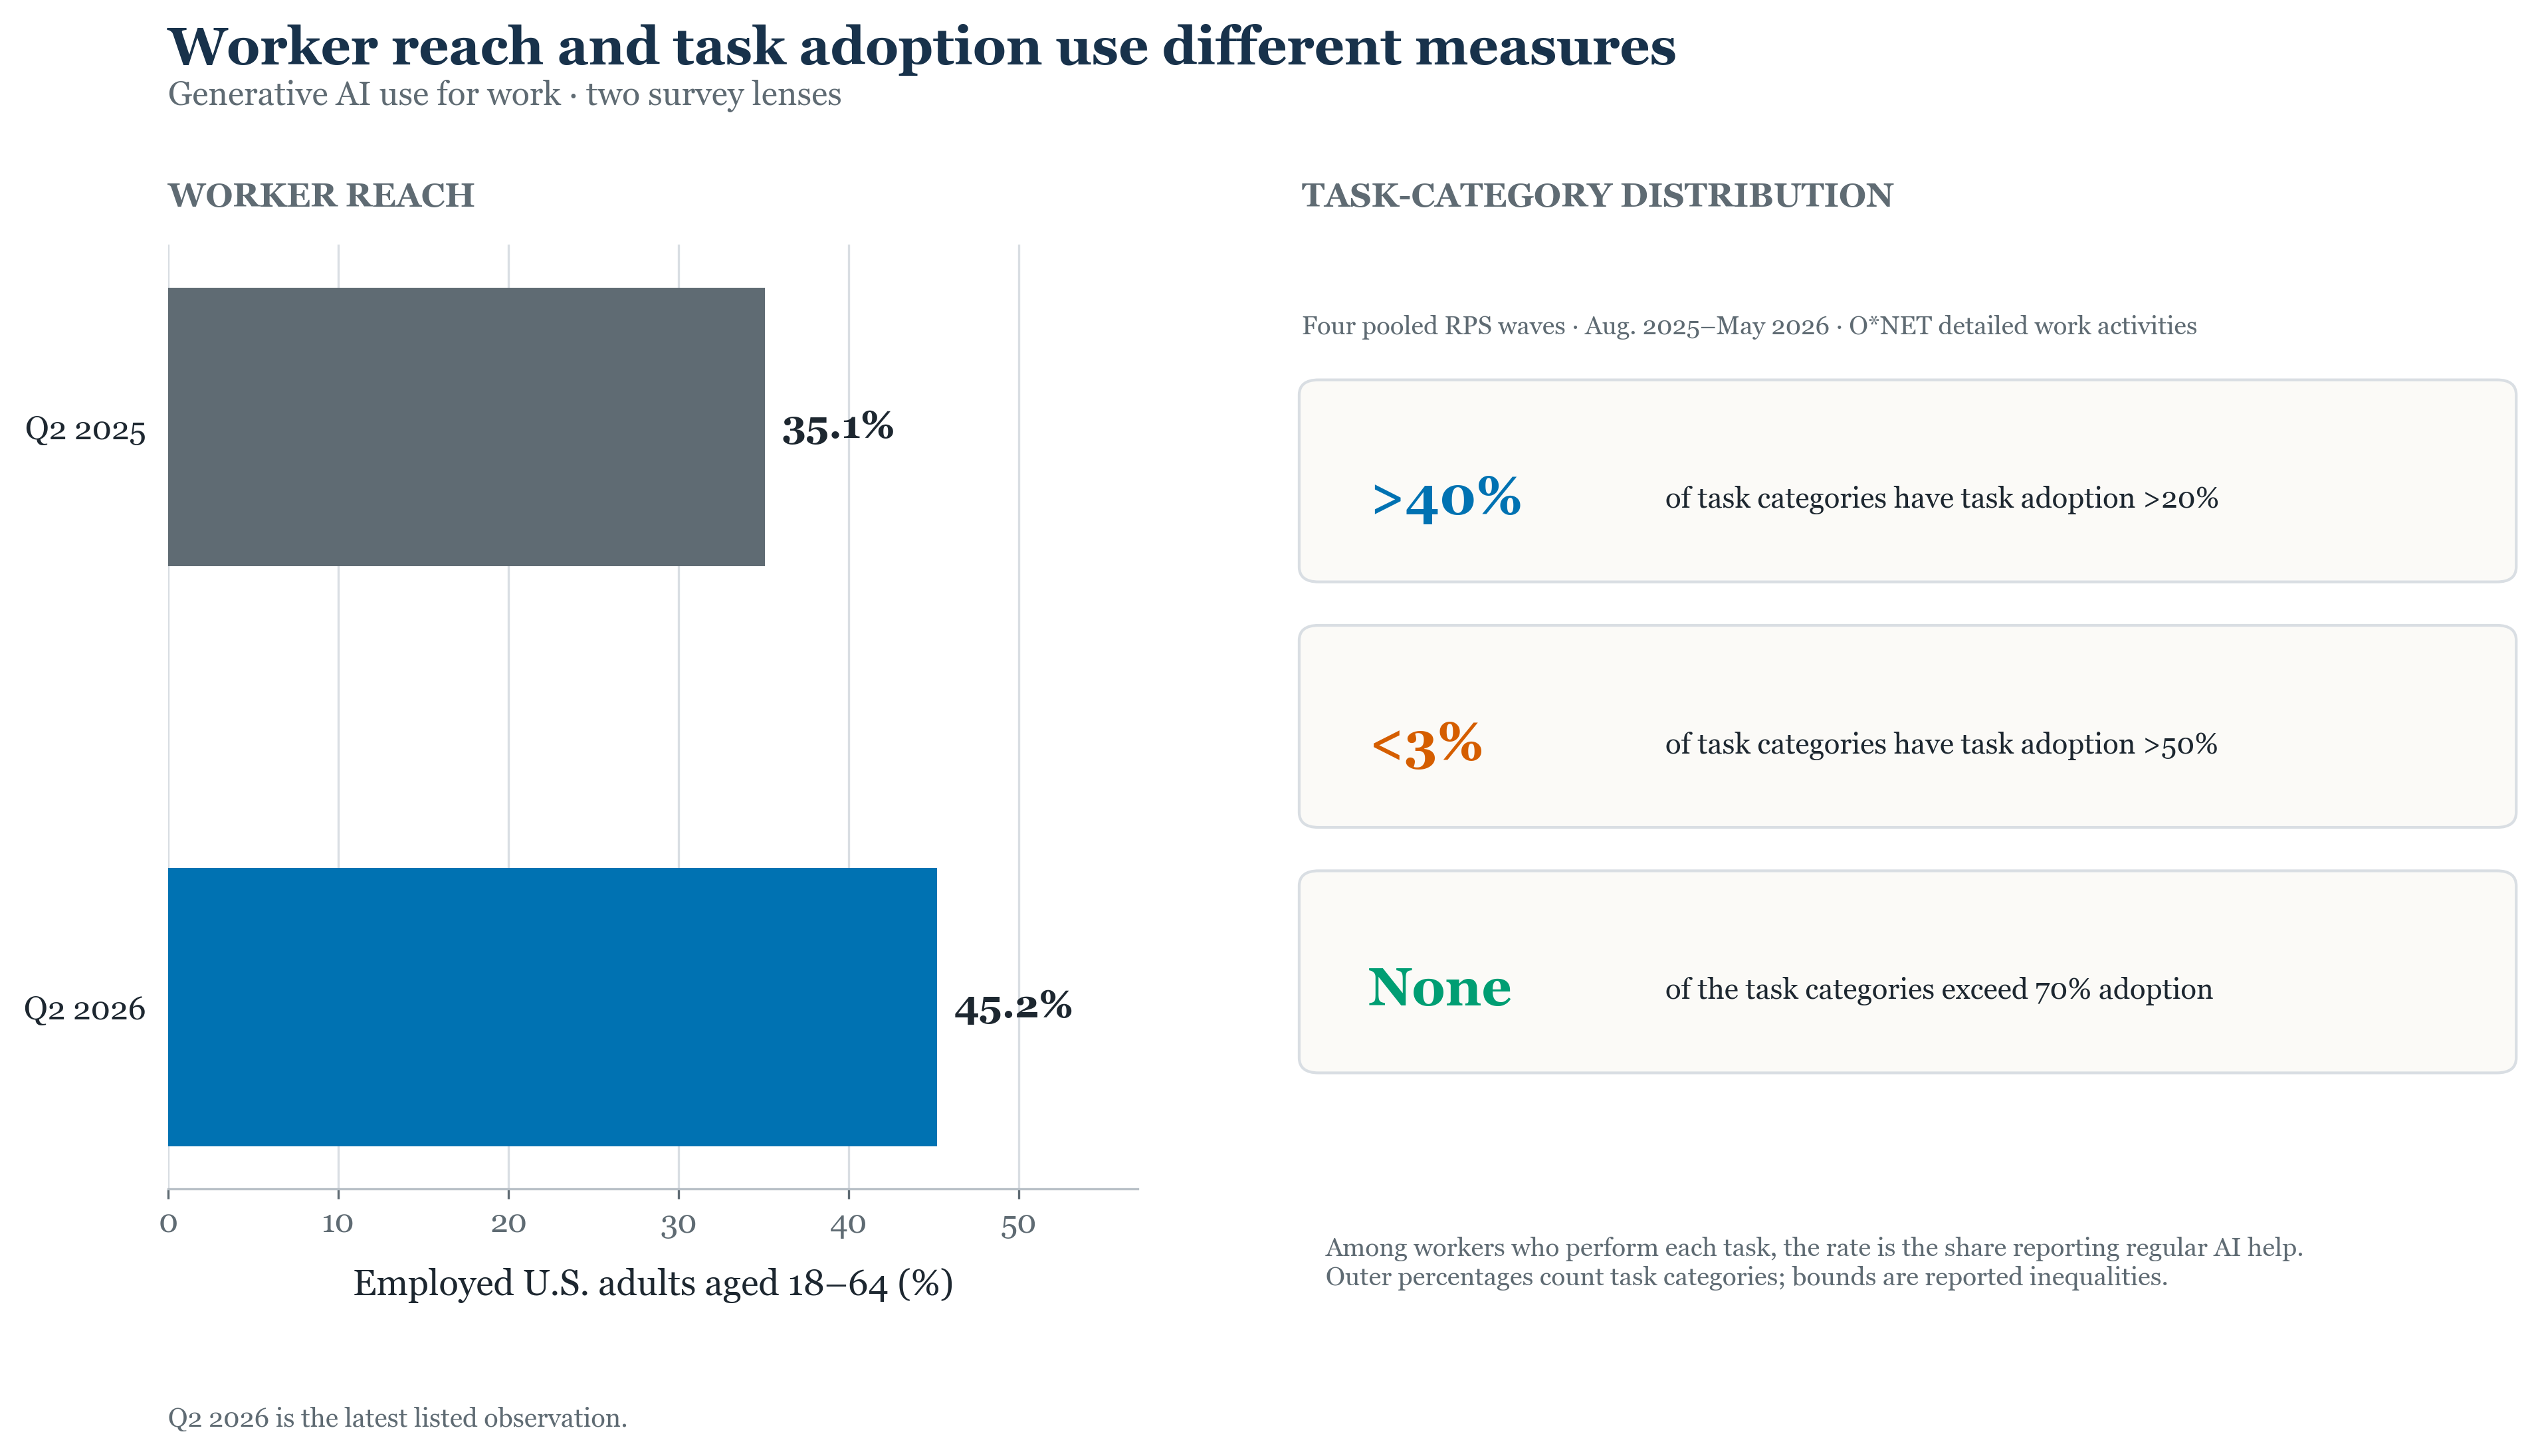
Worker observations: Q2 2025 and Q2 2026; task-category distribution: four RPS waves pooled Aug. 2025–May 2026 · Percentages with separate worker and task-category populations and denominators
Select or focus a chart item to read its scope and limitation.
View exact data: Worker reach and task-category adoption thresholds
| Measure | Value | Population or denominator | Period and source |
|---|---|---|---|
| Worker reach · Q2 2025 | 35.0794637550% reported · 35.1% displayed | Employed U.S. adults aged 18–64 | Q2 2025 · FRED work-use series |
| Worker reach · Q2 2026 | 45.1993181231% reported · 45.2% displayed | Employed U.S. adults aged 18–64 | Q2 2026 · FRED work-use series |
| Derived worker-reach change | +10.1198543681 percentage points · +10.1 displayed | Employed U.S. adults aged 18–64 | Q2 2025 to Q2 2026 · calculated from FRED values |
| Task-category threshold: task adoption >20% | >40% of categories | Outer denominator: O*NET detailed work-activity categories; within each task, all workers performing that task | Four RPS waves pooled Aug. 2025–May 2026 · St. Louis Fed analysis |
| Task-category threshold: task adoption >50% | <3% of categories | Outer denominator: O*NET detailed work-activity categories; within each task, all workers performing that task | Four RPS waves pooled Aug. 2025–May 2026 · St. Louis Fed analysis |
| Task-category threshold: task adoption >70% | None | O*NET detailed work-activity categories; each task rate uses workers performing that task | Four RPS waves pooled Aug. 2025–May 2026 · St. Louis Fed analysis |
A worker can use AI for one assignment while other tasks receive no regular help. Broad worker reach can therefore coexist with rare majority adoption across task categories.
For an AI supplier, that contrast points to a chain of customer decisions. An employee may choose a tool for an assignment. A manager considers whether colleagues can use it consistently. A buyer decides whether to fund it. The organization determines how the product fits its work, who reviews outputs and how mistakes are handled. Investors can follow that chain to see whether individual use is becoming an accepted, purchased process.
The buyer and user may value different things. Someone doing the work might prize help with a difficult assignment. A budget holder may want a reason to allocate funds across a team. People responsible for quality or privacy may need checks before use becomes routine. A supplier’s account of demand grows more concrete when it identifies these stakeholders and explains how the product serves each of them.
Pricing gives investors another way to test the connection. For a product sold by seat, useful evidence includes paid seats, active use and customer decisions to expand or renew. For a product sold by usage, investors can ask what activity is billable and how it relates to a customer workflow. In either case, the important link is between what the organization pays for and what its employees use. Customer accounts of results can help explain why that link has value.
The task findings also leave room for different business paths. A supplier focused on a narrow set of valuable tasks might earn strong customer commitment without serving most workers who perform them. A broadly accessible product might attract interest across many kinds of work while facing a harder path to sustained spending. The commercial distinction lies in whether customers buy the assistance, incorporate it into work and find the results worth the cost.
Workflow fit becomes especially consequential where an error or inappropriate use of information carries a cost. The St. Louis Fed authors report adoption below exposure predictions in occupations built around sensitive records and discuss privacy rules and error costs as concerns. A prospective customer in such work may ask which information a product can handle, when a person checks its output and how errors are corrected. An investor can look for specific answers in product design and customer practice.
Those requirements can shape adoption inside a company. A tool available to every employee may be used only for approved tasks. A narrower tool may be closely woven into one team’s process. The first could have more potential users; the second could have a clearer place in a purchased workflow. Customer decisions about deployment and continued spending help reveal which position is proving durable.
A useful company-level account connects five points: the buyer, the paid product, its use within a workflow, the checks that make its output acceptable and the value the customer sees. Each point suggests a question for disclosures or customer discussions. Does interest reach someone with a budget? Does paid access see use? What review does that use require? What results lead a customer to expand or renew? A carefully bounded application may matter greatly to the organization paying for it.
Dated watchlist
These are dates for readers to check the evidence.
- Nov. 30, 2026: Check the FRED work-use series for a newer comparable observation.
- Jan. 31, 2027: Review primary company disclosures for paid usage, workflow deployment and customer outcomes.
Rising reported use gives investors more reason to follow the path from worker interest to customer spending and results. Readers tracking that connection can explore AI Economy Radar’s public articles index.