
Subtitle: Ramp August data shows broad demand for AI tools while overlapping vendor payments and record provider switching make durable leadership harder to infer
Excerpt: More than half of businesses in Ramp’s U.S. sample paid for AI in August 2026. Yet the same data implies substantial overlap between Anthropic and OpenAI customers, while a separate switching measure reached a record in September. Investors need to distinguish category growth from provider loyalty.
A crowded lead
In August 2026, 56.1% of U.S. businesses in Ramp’s platform sample paid for at least one AI tool. Anthropic reached 43.8% of that sample and OpenAI reached 39.8%, measured by payments for subscriptions or tokens. Ramp’s AI Index and its September analysis show substantial paid reach—but also a complication for anyone trying to name a durable winner.
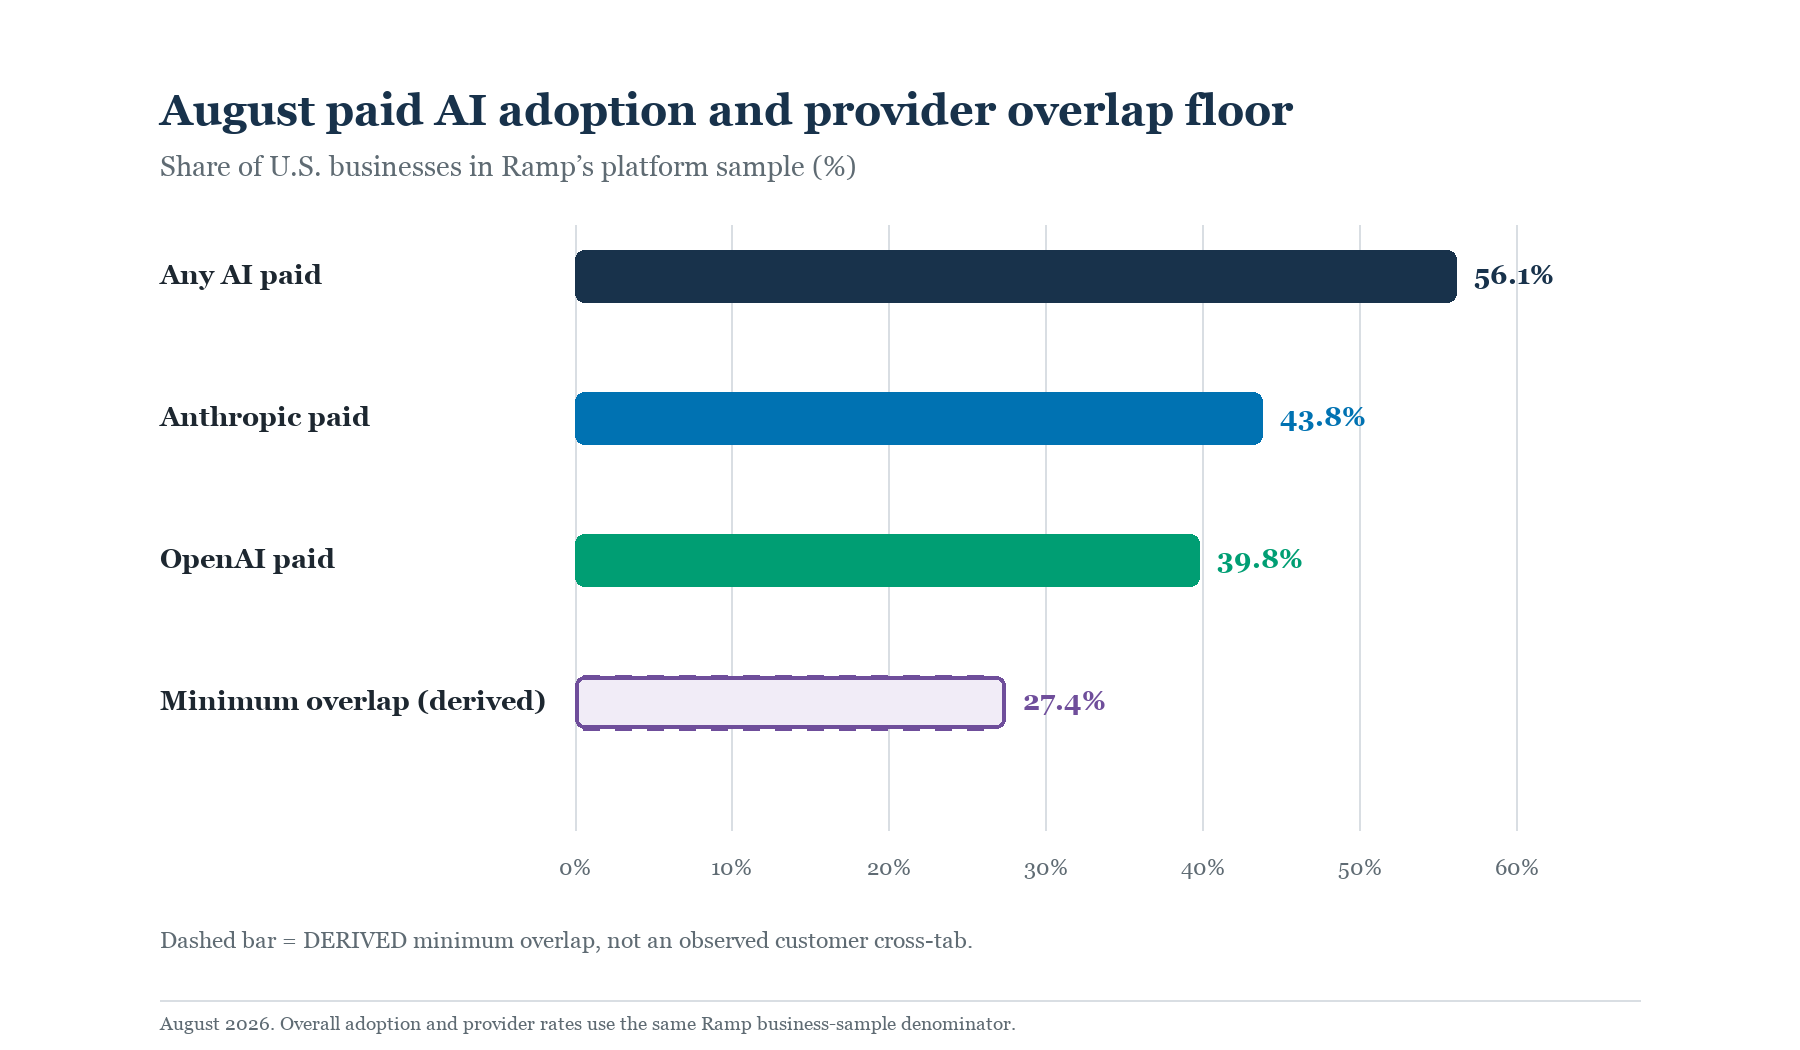
Using the unrounded August rates—43.78% for Anthropic, 39.76% for OpenAI, and 56.13% for any AI—inclusion–exclusion yields a minimum overlap of 27.41 percentage points of Ramp’s business sample, or about 49% of AI payers. This is a derived floor, not a published firm-level cross-tab or a measure of spending.
August paid AI adoption and provider overlap floor
Horizontal bars share one denominator: all U.S. businesses in Ramp’s platform sample in August 2026. Any AI payment 56.13%, Anthropic 43.78%, OpenAI 39.76%, and a dashed derived minimum Anthropic/OpenAI overlap of 27.41 percentage points. The overlap is an inclusion-exclusion lower bound, not a direct customer cross-tab.
Share of all U.S. businesses in Ramp sample; overlap is a derived lower bound · August 2026; all U.S. businesses on Ramp
Select or focus a chart item to read its scope and limitation.
View exact data: August paid AI adoption and provider overlap floor
| Measure | Rate | Classification / basis |
|---|---|---|
| Any AI payment | 56.13% | REPORTED; all U.S. businesses in Ramp sample. |
| Anthropic payment | 43.78% | REPORTED; all U.S. businesses in Ramp sample. |
| OpenAI payment | 39.76% | REPORTED; all U.S. businesses in Ramp sample. |
| Minimum Anthropic–OpenAI overlap | ≥27.41 percentage points | DERIVED lower bound; not an observed cross-tab. |
The investment thesis is that broad paid adoption establishes demand for business AI, while substantial concurrent provider use and rising switching leave provider lock-in and lasting share unresolved.
Why overlap matters to the economics
A business paying two model providers may be comparing quality, buying different capabilities, serving different teams, or keeping an alternative available. The aggregate figures cannot tell which explanation applies. They do show that one provider’s adoption rate need not come at the direct expense of another’s: a payment to Anthropic and a payment to OpenAI can appear in the same business’s monthly activity.
That distinction changes how investors should read an adoption chart. A provider can gain paying businesses while receiving a small portion of each customer’s AI budget. It can also become the principal supplier for customers that continue to pay a rival. Neither outcome is visible in these rates. The value of a large paying footprint depends on subsequent spending, margins, and persistence—especially when customers have demonstrated the ability to maintain more than one provider relationship.
Concurrent purchasing can benefit buyers. It gives them options when a model’s performance, price, or availability changes, and it can make procurement negotiations more credible. For vendors, the same flexibility creates a continuing need to earn workloads. Product improvements, integration into customer workflows, and reliable service may help defend those workloads; the August payment figures alone cannot show how strong those defenses are.
The tension is counterintuitive: a market in which both leading providers have reached roughly two-fifths of Ramp’s business sample may look close to settled. Mathematically, those rates require extensive overlap within a market where just over half the sample paid for any AI. High adoption can therefore coexist with active competition inside the customer base.
A record switching signal
A separate Ramp Economics Lab analysis published October 6 adds a second warning against treating paid reach as permanent attachment. Ramp reported that the monthly share of firms switching AI model providers, averaged over three months, reached a record 8% in September 2026.
The switching measure does not identify August’s overlapping firms or establish a matched customer cohort, nor does it explain either provider’s growth. Read alongside the August rates, it points to a market in which widespread purchasing has yet to eliminate movement between suppliers.
For investors, the economic question is where that movement lands. If customers can shift workloads readily, model providers may need more product investment or price concessions to retain business. If software integrations and operating habits make shifting costly, today’s concurrent payments may eventually consolidate around a primary supplier. Both are plausible paths; neither is established by a payment count or the switching rate.
The stakes extend beyond model providers. Application companies choosing an underlying model may retain negotiating flexibility when several suppliers remain viable. Business customers may be able to match different models to different tasks. Infrastructure suppliers, meanwhile, can benefit from category demand even if the identity of the leading model provider changes. Each group faces a different question from the one answered by “How many businesses paid for AI?”
What to watch next
On October 31, 2026, investors can compare the latest complete-month Ramp adoption and provider figures then available with August’s baseline. The useful test is whether overall paid adoption keeps expanding while the two vendor rates continue to overlap substantially. That date is a checkpoint for comparison, not a claim about Ramp’s publication schedule.
On January 31, 2027, the same comparison should include the latest complete-month provider-switching measure available. Sustained switching alongside rising paid adoption would strengthen the case that category demand and supplier loyalty are moving on different tracks. A decline in switching would invite a closer look at whether purchasing is settling, though spending and retention evidence would still be needed to value any resulting advantage.
Ramp’s card and bill-pay data covers more than 70,000 businesses and skews toward smaller, mid-market, and technology-oriented firms. Payments outside Ramp can be missed; these rates are a platform view, not a U.S. census. Their strongest message is nonetheless consequential: businesses are paying for AI at scale, while the contest to keep their spending remains open.
Explore AI Economy Radar’s article index for more analysis.