
Research cutoff: 7 October 2026.
Three Taiwanese suppliers of circuit-board materials and substrates reported substantial revenue growth in the second quarter of 2026. Elite Material and Taiwan Union Technology more than doubled revenue from a year earlier; Unimicron grew by about a third. All three had higher gross margins and larger inventories. For investors, the question is what those changes say about future earnings: do the results show lasting pricing power, and how much might product mix, production yields and costs contribute?
The distinction matters because a higher gross margin shows that a company retained more gross profit from each dollar of revenue in the reported quarter. It does not identify which factor produced the improvement or establish that customers will keep paying more per unit. The companies’ disclosures give a clear picture of issuer-level growth, but a narrower view of its causes.
| Issuer | Revenue, Q2 2026 vs. Q2 2025 | Gross margin, Q2 2026 vs. Q2 2025 | Inventory, June 30, 2026 vs. June 30, 2025 |
|---|---|---|---|
| Elite Material | NT$47.275bn vs. NT$22.508bn; +110.0% | 33.85% vs. 30.34% | NT$23.664bn vs. NT$10.936bn; +116.4% |
| Taiwan Union Technology | NT$14.301bn vs. NT$6.780bn; +110.9% | 29.7% vs. 21.2% | NT$10.077bn vs. NT$3.717bn; +171.1% |
| Unimicron | NT$42.890bn vs. NT$32.466bn; +32.1% | 24.8% vs. 13.1% | NT$20.559bn vs. NT$14.130bn; +45.5% |
Revenue is a quarterly flow; inventory is a balance at each June 30. The figures cover each entire consolidated issuer. These three companies are a sample, not a sector total.
Q2 revenue growth was broad, but not uniform
Bar chart of year-on-year Q2 2026 consolidated revenue growth: Elite Material 110.0%, Taiwan Union Technology 110.9%, Unimicron 32.1%.
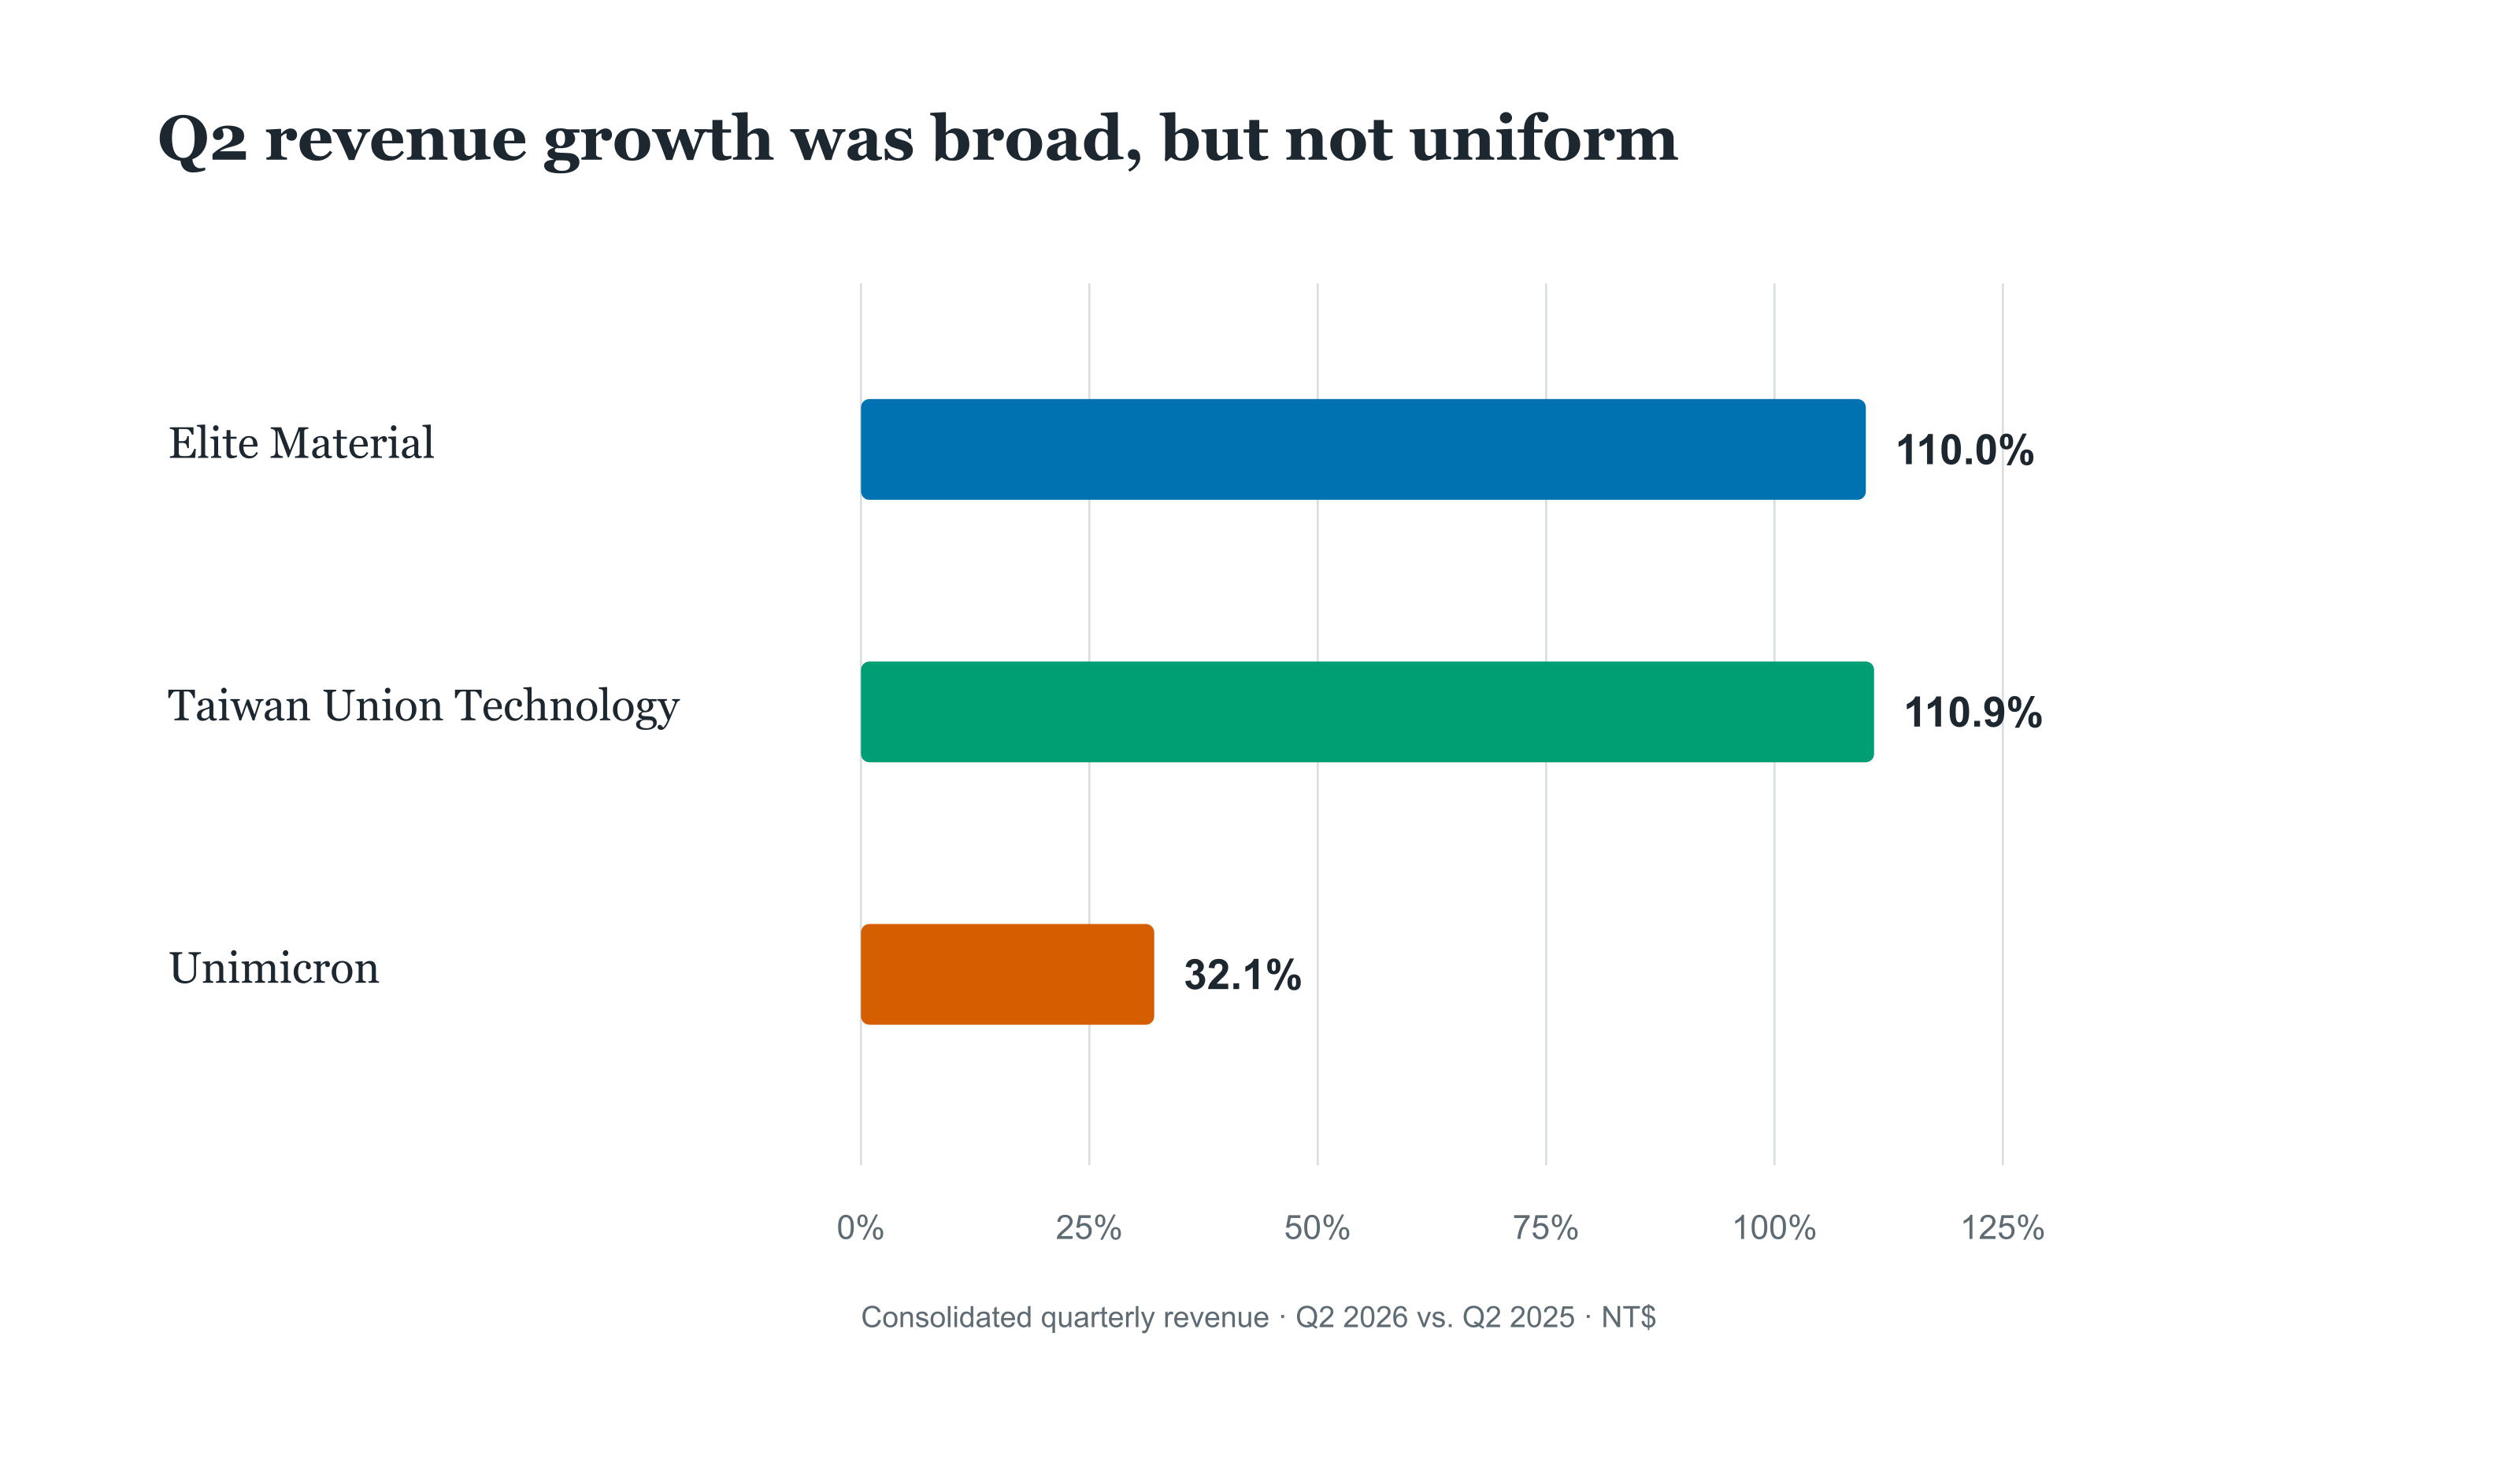
Year-on-year revenue growth (%) · Q2 2026 vs. Q2 2025
Select or focus a chart item to read its scope and limitation.
View exact data: Q2 revenue growth was broad, but not uniform
| Issuer | Q2 2026 revenue | Q2 2025 revenue | Growth | Basis |
|---|---|---|---|---|
| Elite Material | NT$47,275.194m | NT$22,507.694m | 110.0% | Issuer-wide quarterly flow; growth derived. |
| Taiwan Union Technology | NT$14,301.000m | NT$6,780.000m | 110.9% | Issuer-wide quarterly flow; growth derived. |
| Unimicron | NT$42,890.000m | NT$32,466.000m | 32.1% | Issuer-wide quarterly flow; growth derived. |
What the margins establish
Elite Material and Taiwan Union Technology supply laminates and copper-clad laminate materials used in circuit boards. Elite Material’s consolidated gross profit rose to NT$16.003 billion from NT$6.829 billion as revenue grew 110.0%. Its gross margin rose to 33.85% from 30.34%, based on the revenue and gross-profit figures in its reviewed financial statements. The company converted a greater share of sales into gross profit while handling a much larger revenue base. Those results alone cannot separate a change in selling prices from changes in product mix, production yields or input costs.
Taiwan Union Technology shows a larger margin step in its second-quarter presentation: reported gross margin was 29.7%, against 21.2% a year earlier, alongside 110.9% revenue growth. Higher sales coincided with stronger gross-profit conversion. The presentation does not establish how much of that gain came from prices. It also does not provide an absolute gross-profit figure for this comparison, so the margin and revenue figures are the appropriate reported measures to use.
Unimicron is a broader printed-circuit-board and packaging-substrate supplier, making its company-wide results a different kind of signal. Its second-quarter presentation reports gross profit of NT$10.638 billion, up from NT$4.246 billion, with gross margin rising to 24.8% from 13.1%. Operating margin also rose, to 15.5% from 4.6%. That progression strengthens the evidence that better gross-profit conversion carried through the operating business in the quarter. It still does not isolate the return on any one product or customer program.
Unimicron provides more detail about where some growth was concentrated. Its presentation labels ABF as 52% of its second-quarter 2026 product mix, up from 46% a year earlier, and reports 51% year-on-year ABF growth. It separately labels AI Data Center as 61% of its end-market mix, up from 47%, and reports 71% year-on-year growth for that end market. Product mix and end-market mix describe overlapping views of the same company; their percentages cannot be added. They support a narrower conclusion: Unimicron reports strong growth in a business it classifies as AI Data Center. They do not measure end-user AI adoption, customer returns on AI spending or the profitability of ABF alone. Rounded mix shares also cannot support precise revenue estimates for either category.
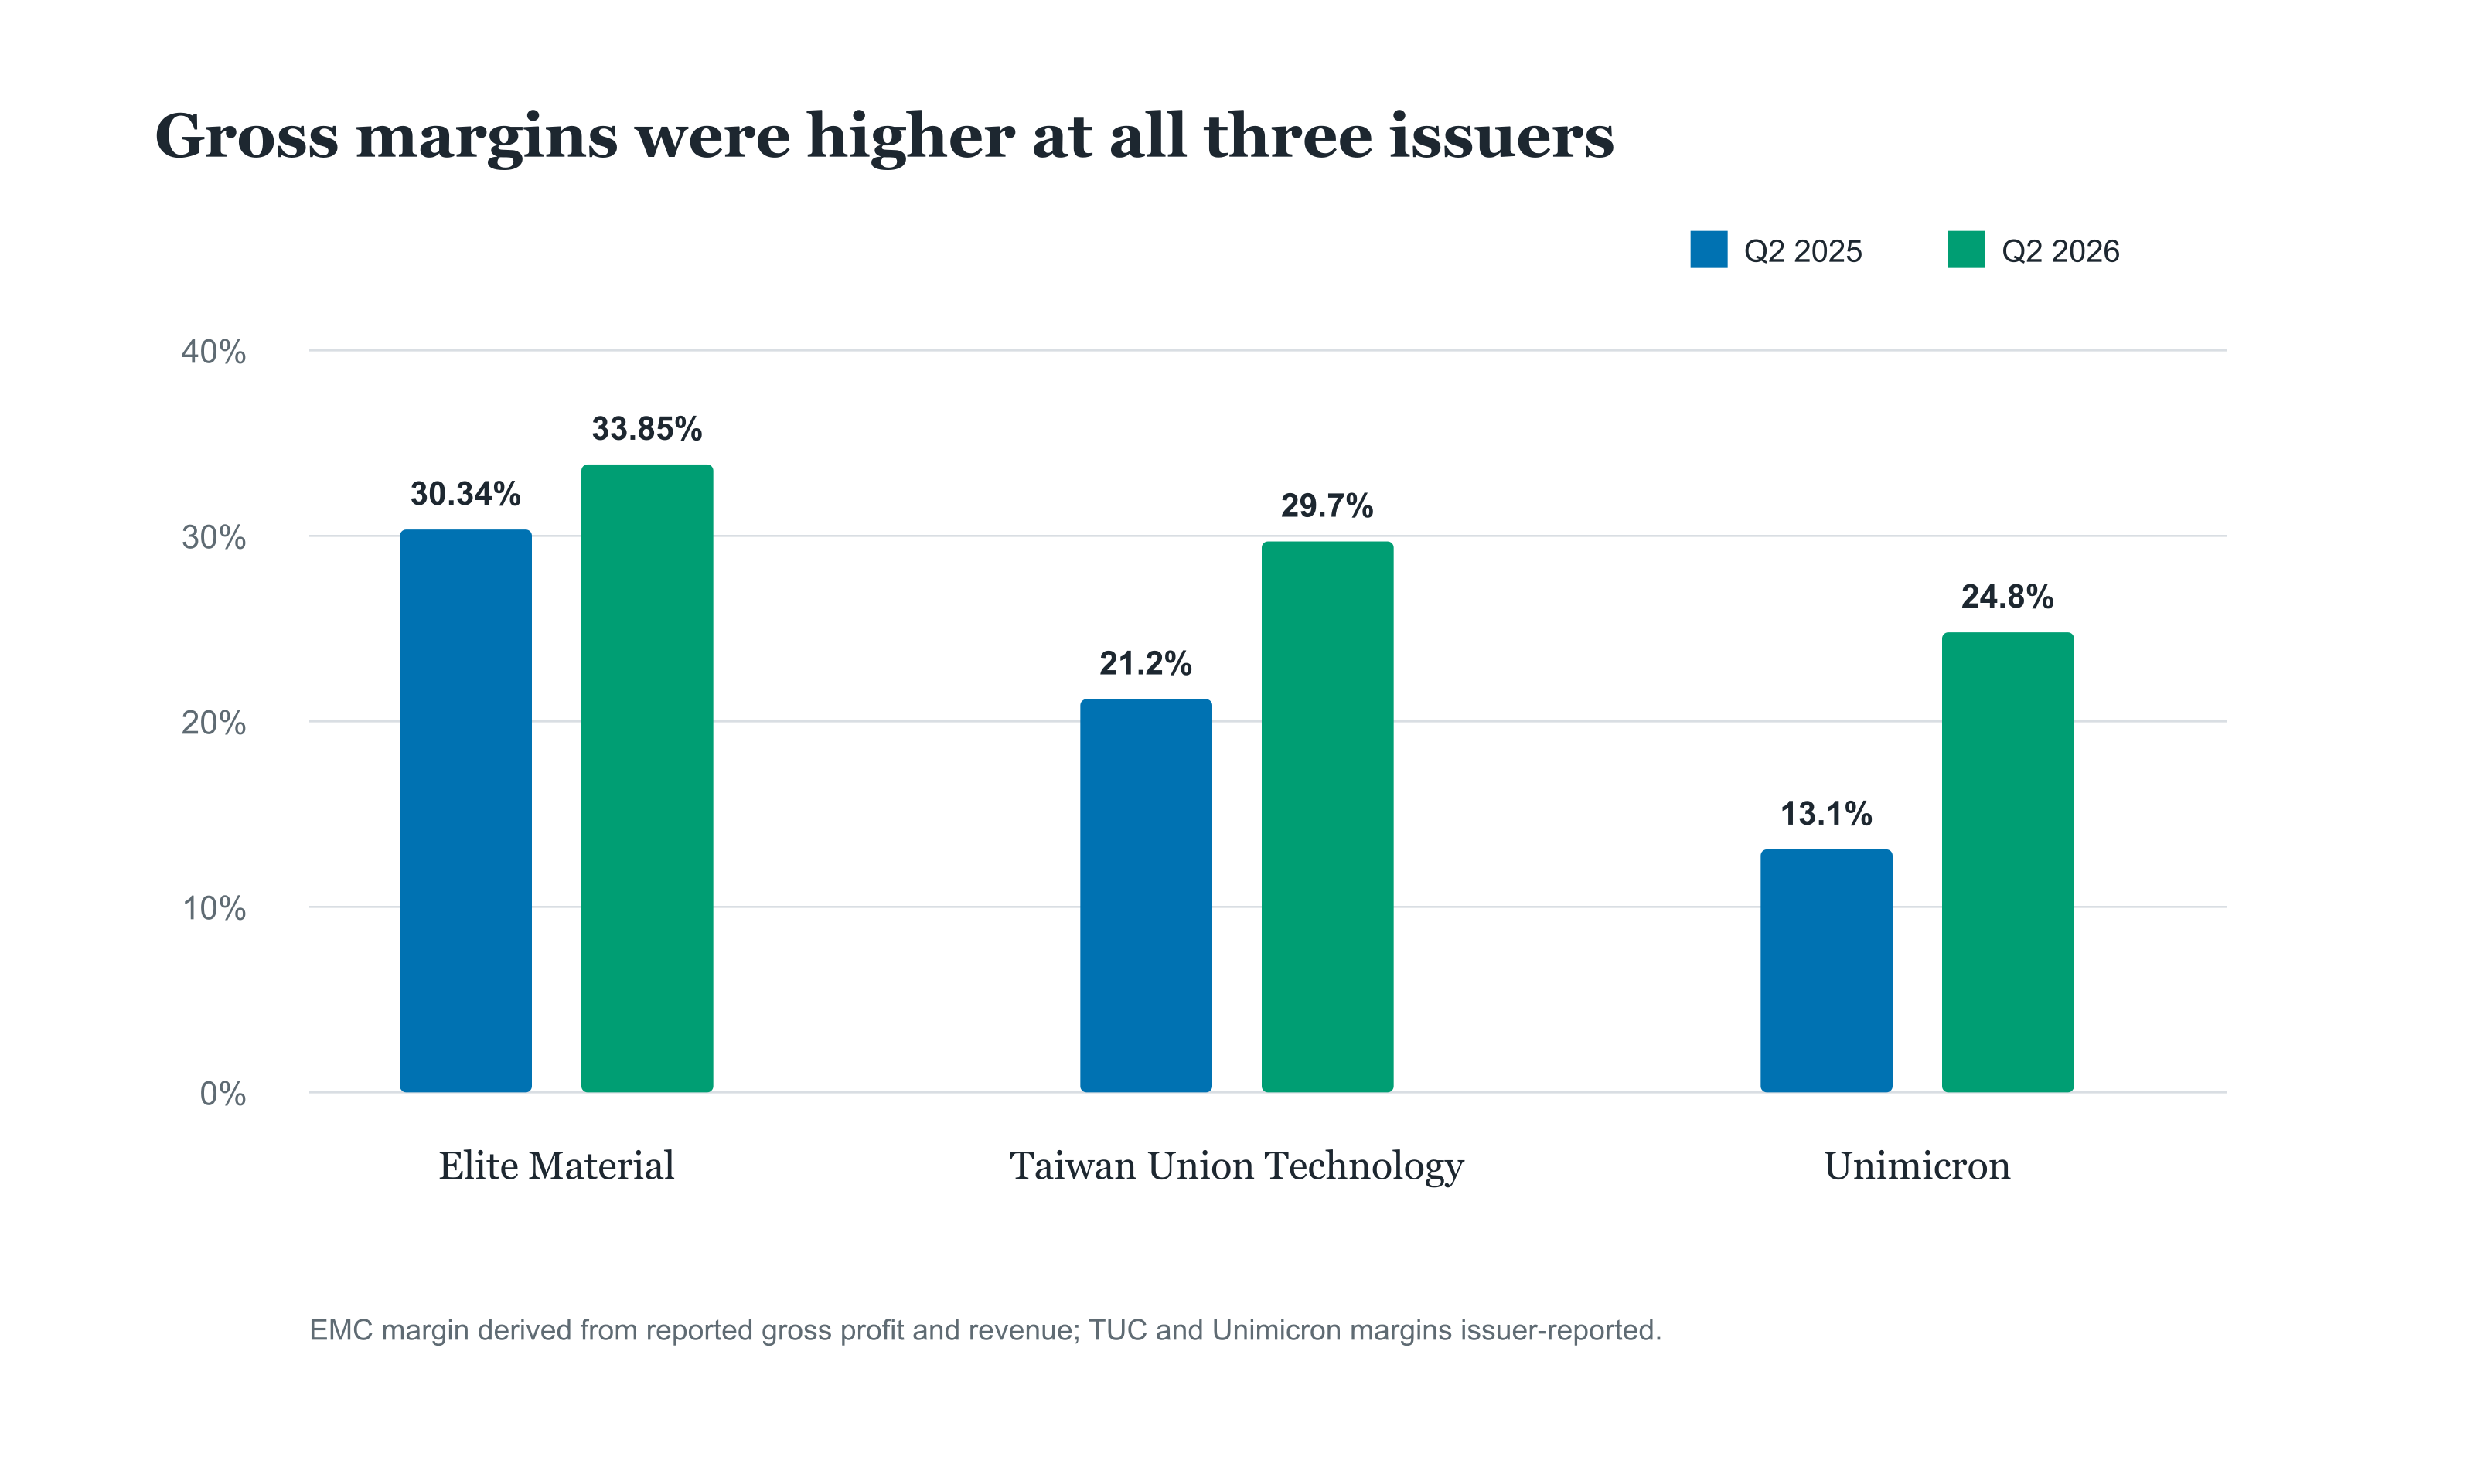
Gross margins were higher at all three issuers
Paired gross-margin values for Q2 2025 and Q2 2026: Elite Material 30.34% and 33.85%; Taiwan Union Technology 21.2% and 29.7%; Unimicron 13.1% and 24.8%.
Elite Material
Gross margin (%) · derived from reported gross profit / revenue
Taiwan Union Technology
Gross margin (%) · issuer-reported consolidated gross margin
Unimicron
Gross margin (%) · issuer-reported consolidated gross margin
Select or focus a chart item to read its scope and limitation.
View exact data: Gross margins were higher at all three issuers
| Issuer | Q2 2025 | Q2 2026 | Basis |
|---|---|---|---|
| Elite Material | 30.34% | 33.85% | derived from reported gross profit / revenue |
| Taiwan Union Technology | 21.2% | 29.7% | issuer-reported consolidated gross margin |
| Unimicron | 13.1% | 24.8% | issuer-reported consolidated gross margin |
Inventory is the next test
Inventory rose at every issuer, most sharply at Taiwan Union Technology. Its June 30 balance was NT$10.077 billion, compared with NT$3.717 billion a year earlier. Elite Material’s balance was NT$23.664 billion, up from NT$10.936 billion; Unimicron’s was NT$20.559 billion, up from NT$14.130 billion. These are substantial additions to materials and goods held at a point in time, reported alongside strong quarterly sales. They should not be treated as a share of quarterly revenue: one measure is a balance and the other is a flow.
A larger inventory balance can support a production ramp or reflect higher-value products moving through the system. It can also leave more capital tied up if orders, production or shipments slow. The reported balances alone do not decide between those explanations. Without a comparable breakdown of inventory composition, aging and subsequent cash conversion, it would be premature to classify the build as either evidence of a shortage or evidence of weak demand.
Each issuer’s own turnover series can help test whether inventory is moving as expected. Taiwan Union Technology labels its measure Inventory Turnover Days and reports 91 days, up from 62 a year earlier. Unimicron labels its measure Net Inventory Turnover Days and reports 56 days, up from 49. Both increases make future movement in their respective series relevant, but the measures have different names and should be evaluated within each issuer rather than ranked against each other. Elite Material’s cited statements provide the inventory balances used here but do not disclose an inventory-days figure for this comparison.
Revenue growth, higher margins and a larger inventory balance can therefore coexist without contradiction. A supplier may be earning more on current shipments while also carrying more material for future production. The question is whether that added stock converts into shipments and cash while gross margins remain strong. The second-quarter figures establish the starting point; they do not answer that later question.
Inventory grew at each issuer by June 30
Bar chart of year-on-year growth in consolidated inventory balances at June 30, 2026: Elite Material 116.4%, Taiwan Union Technology 171.1%, Unimicron 45.5%.
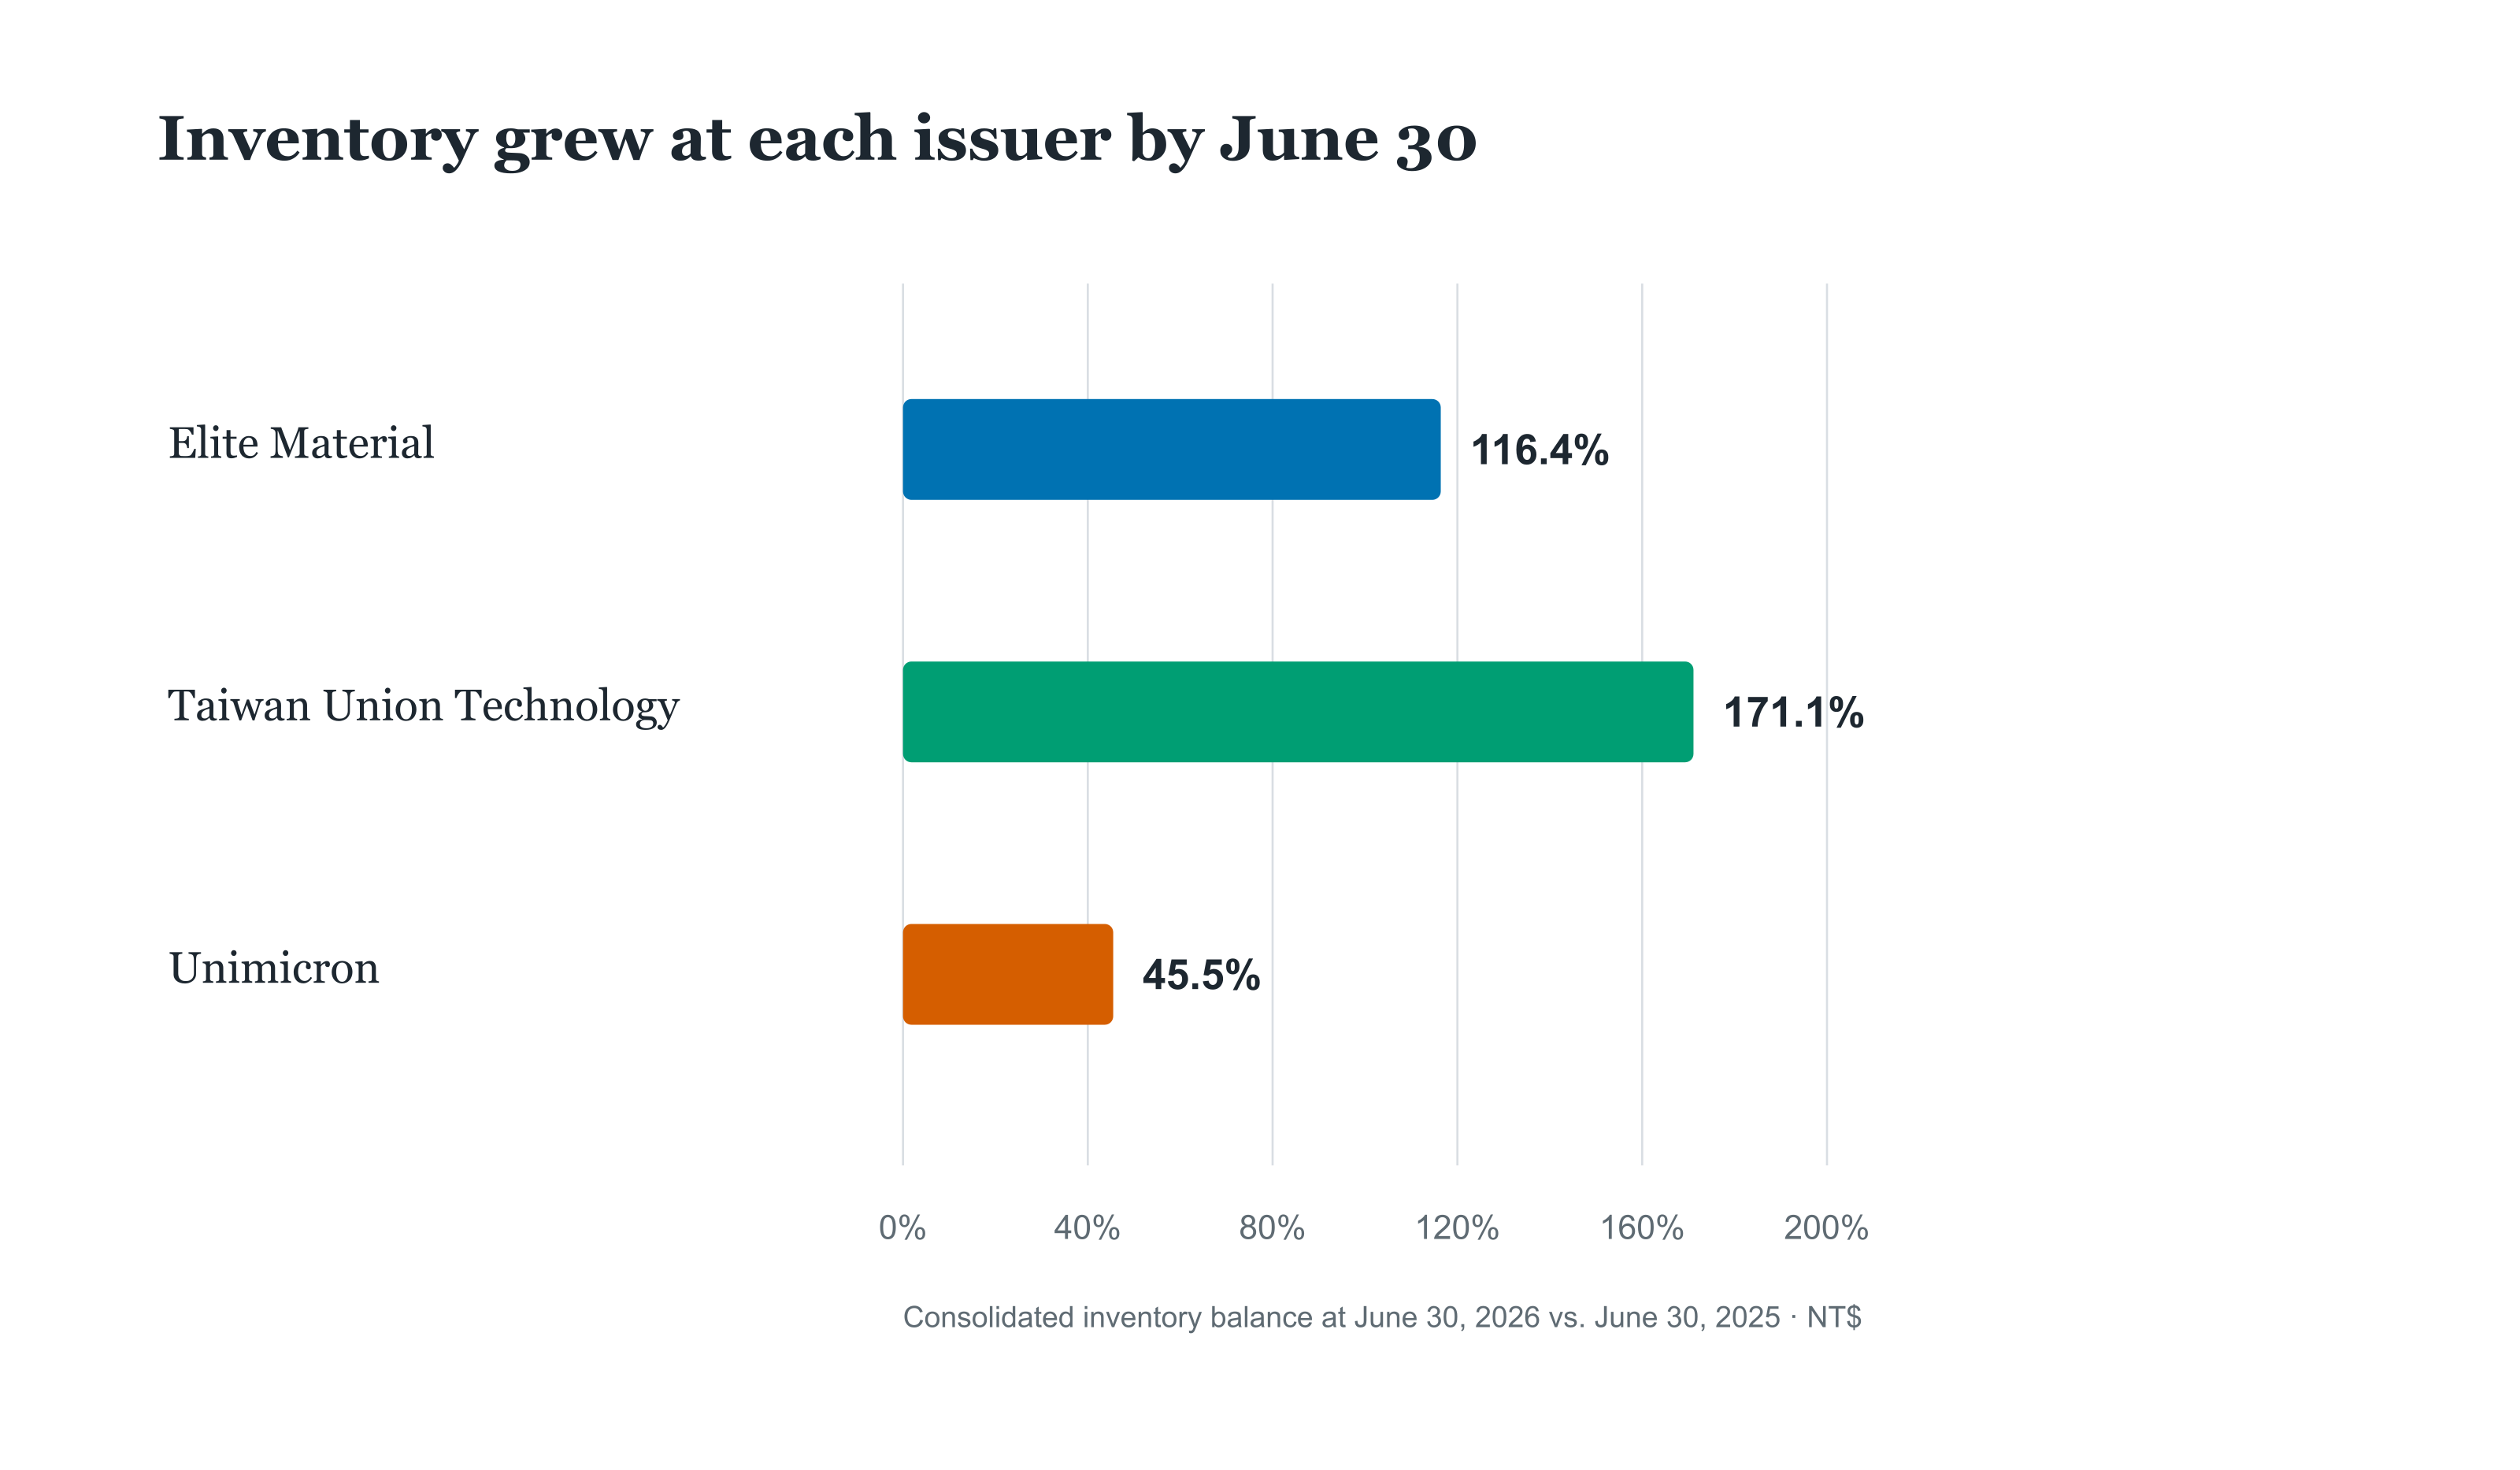
Year-on-year inventory growth (%) · June 30, 2026 vs. June 30, 2025
Select or focus a chart item to read its scope and limitation.
View exact data: Inventory grew at each issuer by June 30
| Issuer | Inventory at June 30, 2026 | Inventory at June 30, 2025 | Growth | Basis |
|---|---|---|---|---|
| Elite Material | NT$23,663.591m | NT$10,936.015m | 116.4% | Issuer-wide point-in-time stock; growth derived. |
| Taiwan Union Technology | NT$10,077.000m | NT$3,717.000m | 171.1% | Issuer-wide point-in-time stock; growth derived. |
| Unimicron | NT$20,559.000m | NT$14,130.000m | 45.5% | Issuer-wide point-in-time stock; growth derived. |
What would strengthen the case?
For Elite Material, another period of strong gross-profit conversion would carry more weight if inventory growth moderated or the company supplied clearer evidence that added stock was moving through production. For Taiwan Union Technology, the combination to watch is gross margin and its own Inventory Turnover Days: a resilient margin with stable or falling days would make the recent inventory build easier to reconcile with continuing demand. A rising days figure alongside a weakening margin would point to a less favorable interpretation. These are conditions to monitor, not predictions about the next quarter.
For Unimicron, the useful test spans its reported AI Data Center and ABF growth, company-wide profitability, and its own Net Inventory Turnover Days. Continued growth in the labelled businesses would be more persuasive if gross and operating margins held up while inventory days stabilized or fell. If growth in those categories slowed as inventory days continued to rise, the reported mix would provide less reassurance about how quickly the company could turn its stock into sales. Because its total revenue covers a broader PCB and substrate business, company-wide margin changes still could not be assigned solely to ABF or AI Data Center customers.
The current evidence shows clear revenue growth and margin improvement, with a less specific picture of the causes and durability. All three companies grew revenue and improved gross margin year over year. Unimicron also reported strong growth in a company-labelled AI Data Center end market. Whether those gains reflect durable unit pricing power requires evidence that the issuer disclosures here do not provide. Subsequent margins, each company’s inventory movement and cash conversion will help show how much of the second-quarter strength persists.
Sources and data note: Elite Material reviewed consolidated financial statements, pages 5–6; Taiwan Union Technology second-quarter presentation, slides 2 and 4; and Unimicron second-quarter presentation, pages 4, 5, 7 and 8. Figures were available by October 7, 2026. Revenue and margins compare Q2 2026 with Q2 2025; inventory compares June 30 balances. All metrics are consolidated issuer-wide figures. Revenue and inventory growth are calculated from reported amounts and rounded to one decimal place; Unimicron’s ABF and AI Data Center growth rates are issuer-reported. Inventory-days labels differ by issuer.